The global financial crisis: Behind us but far from over
Ten years ago this month, Lehman Brothers, the fourth-largest US investment bank, filed for bankruptcy protection.

It was a seminal event in what has come to be known as the global financial crisis (GFC). Even a decade on, the massive damage it inflicted across the world continues to shape both the global economy and investor behaviour.
Just how bad was it?
The epicenter of the crisis was a wave of US subprime mortgage failures that hit the housing and financial sectors and then spilled over into the broader economy and far beyond the United States. It created a synchronised global recession. For a number of countries, including Greece, Italy, and Spain, recovery from this recession to pre-crisis GDP levels has taken even longer than it had from the Great Depression. Other countries still aren't there yet.
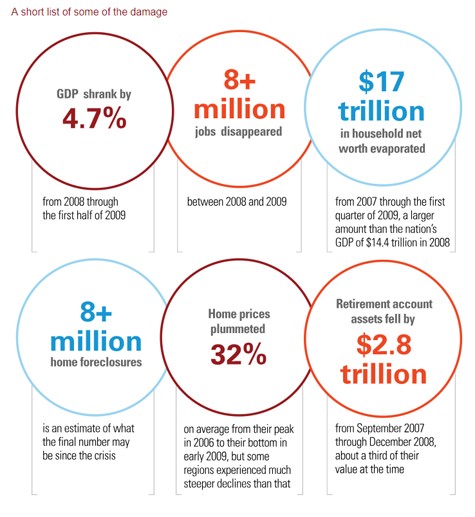
Although numbers alone can't capture the full impact of what happened, below are some indicators for the United States that at least give a sense of the scale of the crisis.

Sources: Vanguard, Financial Crisis Inquiry Report: Final Report of the National Commission on the Causes of the Financial and Economic Crisis in the United States, and “The 2007–2009 Financial Crisis: An Erosion of Ethics: A Case Study” in Journal of Business Ethics, December 2017, Volume 146, Issue 4, pp. 805–830.
Some healing from the GFC and some enduring scars
“Obviously, we're in a much better place right now than we were a decade ago,” said Roger Aliaga-Díaz, Vanguard chief economist for the Americas. “The global economy has been expanding—the US is in its ninth year of expansion, which is the second-longest on record, and most developed economies are at or near full employment. And inflation remains modest despite unprecedented monetary stimulus.
“But on the other hand,” he noted, “the GFC set in motion or accelerated some deep shifts in the global economy that leave us still short of 'pre-crisis normal,' according to some key metrics. I'd point specifically to wages, global growth, international trade, and interest rates as prime examples of that.”
- Slower global growth, less international trade. The financial meltdown put a brake on the debt-fueled consumption boom in the developed world and, with it, the main growth driver for export-oriented emerging markets. The US, for example, began buying less abroad, causing its trade deficit to drop from close to 6% of GDP in 2006 to about 2.5% post-crisis, while China's trade surplus shrank from 10% of GDP to around 2%. (They are still at roughly those levels today.) The abrupt drop-off in international trade accelerated the drive of some emerging markets like China to rebalance their economies from export-oriented manufacturing production toward domestic-oriented services. Other emerging markets, especially commodity exporters, have struggled to reorient their economies. As a result, emerging markets are not the engines of global growth they once were. Growth in China has slowed from an annual average of about 10% for the two decades prior to the GFC to about 6.5% since then. Overall emerging-market growth has fallen from about 7% to about 4% over the same time frame.
- Persistently low interest rates. Global demand for “safe assets,” such as high-quality government bonds, had been increasing well before the GFC. One reason was the burgeoning retirement savings of aging populations transitioning toward more conservative portfolios. A second reason was a buildup of reserves by emerging-market central banks in response to their traumatic currency crises of the 1980s and 1990s, and more recently by their attempts to offset the effect of quantitative-easing policies of the last decade on their currencies. The GFC caused a collapse in the availability of those assets, effectively shrinking the pool of what constituted “safe.” Before the crisis, many investors felt that financial assets, such as synthetically engineered AAA-rated securities, securitised mortgages, and related derivatives in the US, as well as euro-backed peripheral government bonds in Europe, were all valid alternatives to Treasuries. After the US housing and European debt crises, investors learned that that was not the case.
The deteriorating global supply/demand imbalance resulted in a massive shortage of high-quality, risk-free assets around the world. This had the effect of pushing the prices of the few safe assets left—mainly US Treasuries, British gilts, and German bunds—to extreme highs. Since bond prices and yields move in opposite directions, bond yields and interest rates have reached historical lows.
This global shortage of safe assets is likely to persist and long-term interest rates could well remain at current levels for some time.
- Stagnating wages. In a typical economic recovery, companies have to raise wages in order to attract and retain increasingly scarce workers. However, there hasn't been as strong a demand for more workers in this recovery because global growth has been slower.
Demographic trends across developed markets are an important part of the explanation. In the US, the main reason for the fall in the unemployment rate has been the retirement of baby boomers, a trend that the recession probably accelerated and that is likely to continue for decades. The US labour force participation rate has shrunk by almost 4%, or more than 9 million workers, since the GFC. And because the retiring boomers have been replaced by younger and cheaper workers, the usual post-recession surge in wages, after adjusting for inflation, hasn't materialised.
And yet the financial markets have been surprisingly robust
“The contrast between the economy and the markets couldn't be starker,” observed Vanguard Chief Investment Officer Greg Davis. “While most economic variables showed subpar performance, stocks have delivered solid returns.”
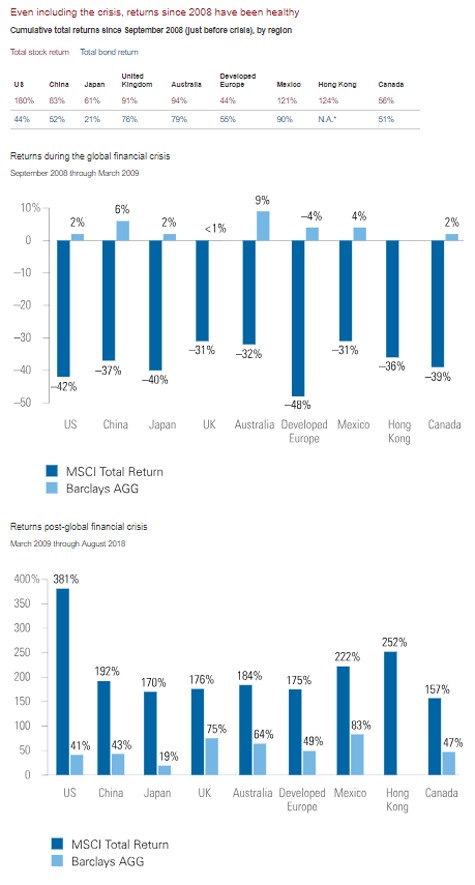
The US market has delivered an outstanding annualised average return of 19% since March 2009 (the crisis-era low) following a meltdown of –47% in the six months prior to that. Those returns put the average annual return for the full ten-year period at 11%, or slightly better than the comparable return of 9% for two decades prior to the crisis.
The performance of bonds was also decent given the low-interest-rate environment—the average annual return for US bonds was 3.5% for the decade. Given the demand for safe assets, neither the extended period of economic expansion nor the unprecedented quantitative easing across much of the developed world has lifted rates very high.

*Data for Hong Kong bond returns were not available.
Note: The periods cover the global financial crisis (September 2008 through February 2009) and the post-crisis period (March 2009 through August 2018).
Sources: Vanguard calculations of stock returns, using data for MSCI Total Return Indices, and Vanguard calculations of bond returns, using Bloomberg Barclays indices.
Lessons for investors
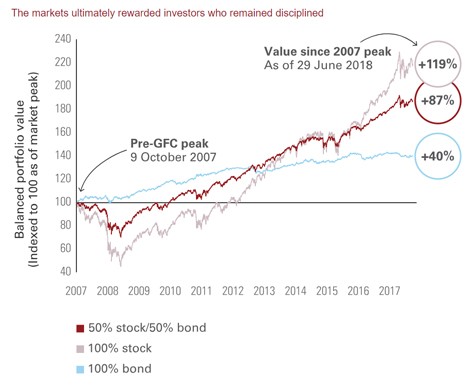
There's no better illustration of the importance of staying the course through good markets and bad than the US equity market's impressive turnaround since the GFC. Investors with a broadly diversified portfolio of 50% stocks and 50% bonds who didn't hit the panic button saw an average annual return of 7% from the pre-crisis market peak in 2007 through June of this year.

Notes: Stocks are represented by the Standard & Poor's 500 Index. Bonds are represented by the Bloomberg Barclays US Aggregate Bond Index. The 50% stock/50% bond portfolio was rebalanced monthly. Data are provided by FactSet and cover the period from 9 October 2007, through 29 June 2018. Past performance is no guarantee of future returns. The performance of an index is not an exact representation of any particular investment, as you cannot invest directly in an index.
Source: Vanguard calculations using data provided by FactSet, as at 29 June 2018.
As would be expected, more risk-tolerant investors with larger portions of their portfolios in stocks would have done better. It's worth noting, however, that a 100% stock portfolio would have been under water for the first four years after the market peaked in 2007.
Maybe the GFC's most enduring effect on investor behaviour is greater fear of loss. Millennials who started investing with Vanguard after the GFC were twice as likely to hold zero-stock portfolios as those who started investing before it occurred. For them, market risk seems to be more salient than potential return.
“Bond returns are likely to remain modest and US equities also face some headwinds due to high valuation levels,” said Mr. Davis, “which translate into subdued return expectations for the next decade. For all the contrast between the performance of the economy and market returns over the past ten years, we may be heading into a period of lower portfolio returns over the next ten years. A global balanced portfolio may return between 3% and 5% after accounting for inflation, compared with a historical return of around 7%.”
One of Vanguard's main goals in providing forecasts about capital markets is to arm investors with realistic expectations about portfolio returns so they can calibrate an appropriate level of savings in order to ensure they reach their investment goals.
Timeless advice
The global economy is in a very different place a decade after the GFC and some investors remain risk-shy (especially those who didn't participate in the great stock bull market that ran from 1982 through 2000). But Mr. Davis said Vanguard's investment approach hasn't changed: “Think about how much risk you can take on and still sleep at night, diversify your portfolio across the globe among stock and bonds, and make sure to rebalance from time to time—those steps should still offer you the best chance for investment success.”
Roger Aliaga-Diaz
Chief Economist for the Americas
vanguardinvestments.com.au
Sofie Korac is an Authorised Representative (No. 400164) of Prudentia Financial Planning Pty Ltd, AFSL 544118 and a member of the Association of Financial Advisers.
Financial Advice Sydney and the North Shore Office based in Gordon NSW


