Rates, inflation and yield – five graphs to help make sense of it all
The relationship between interest rates, inflation and bond yields is complex and as economists we spend a lot of our time trying to make sense of all the moving parts.
This time I'd like to share some valuable insights into what's happening in the US from my colleague Roger Alliaga-Diaz, Chief Economist – Americas for Vanguard's Investment Strategy Group.
1. Three hikes likely, four hikes possible: Downward pressure continues on inflation
Source: 2018 Vanguard Economic and Market Outlook: Rising risks to the status quo, Vanguard white paper, December 2017.
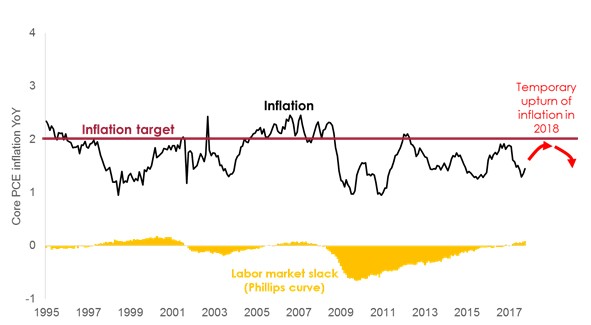
Our first graph plots core inflation in the form of personal consumption expenditure (PCE) against the US Federal Reserve's 2% target, with labour market slack in the form of the Phillips curve, which represents the inverse relationship between unemployment and inflation.
The contribution from the labour market to inflation is relatively small—about 15 basis points for every 1% lower unemployment—compared with the overall 50 basis point shortfall between the current inflation rate and the target rate. Supply-side shocks via globalisation and perhaps more importantly digital technologies continue to exert downward pressure on prices, as they have for the past 25 years.
Vanguard's outlook for US inflation is unchanged as we expect it to increase towards the 2% target, but not by as much as some commentators seem to fear. The expected cyclical upturn in inflation this year to 1.7-1.8% may be less than the Federal Reserve's forecasted 1.9%.
Still, the expected increase in inflation should embolden the Federal Reserve to move forward with its three rate hikes as planned this year. And there may be one more if inflation does exceed 1.9%, which only has a 20-30% probability in our view.
2. Accentuate the positive: Term premium back in black
Vanguard estimations based on Federal Reserve Board H15 Release CMT yields and Survey of Professional Forecasters.
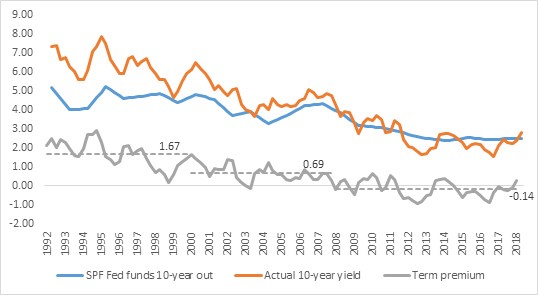
This graph contrasts expectations about interest rate movements (taken from the Survey of Professional Forecasters) with the 10-year bond yield and the term premium—the difference between actual yields and the expected rate path.
With expectations that rates will normalise at 2.5%, the term premium has returned to positive territory after years of being negative. The rise in long-term rates is justified by fundamentals and should persist under fairly conservative assumptions about the term premium. At the same time, we don't expect long-term bond yields to continue marching upwards on a sustained basis given expectations about where the current rate cycle will end.
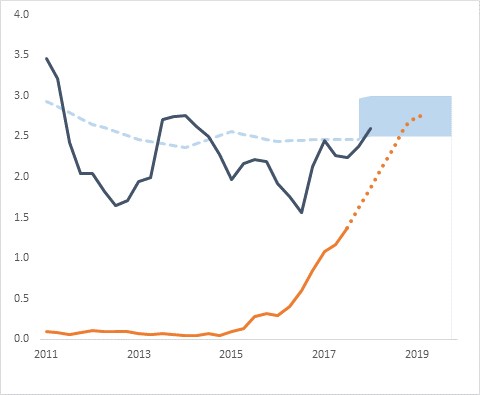
3. On the same page: Rate expectations converge
Sources: Federal Reserve, Survey of Professional Forecasters and FOMC Summary of Economic Projections
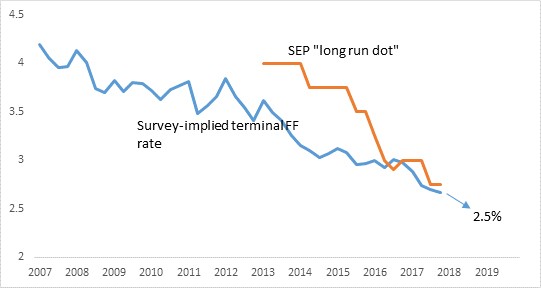
Here we compare how market participants and policymakers see rates—specifically, their expectations around the 'neutral' short-term rate of interest that will apply when the economy achieves a perfect balance.
The blue line shows market expectations, while the red line represents the Federal Open Market Committee's Summary of Economic Projections (SEP), or what economists like to call the 'long run dot'.
As you can see, expectations are converging. The neutral rate is currently between 2.6% and 2.75%, but may go down a little further to 2.5%. Overall we can see that market participants have been more responsive than the Federal Reserve in processing the implications of lower long-term rates. After all, it's the views of market participants that get priced in the bond market, not the Federal Reserve's forecasts.
4. Reasonable assumptions: 10-year bond yield at fair value
Vanguard estimations based on Federal Reserve Board H15 Release CMT yields and Survey of Professional Forecasters
This graph compares the actual 10-year bond yield with market expectations. We've also overlaid two scenarios for the term premium—continuing at zero or even slightly negative (which seems a little extreme given the QE tapering and aggressive fiscal policy outlook) and something closer to the pre-crisis average from 2000-2007.
The data suggests that the 10-year bond yield is at fair value, without taking into account the volatile term premium. It's important to note that the number of rate hikes would have a minimal impact on this fair value calculation.
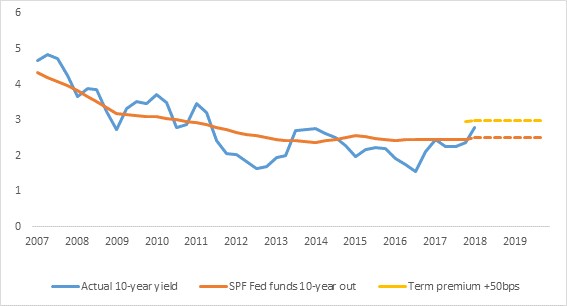
5. No room for error: Fed looking for soft landing
Finally let's overlay the expected glide path for rates on the 10-year bond yield and market expectations, with the shaded area representing fair value.
As you can see, the Federal Reserve's margin for error when it comes to engineering a soft landing is small and the risk of a 'flat curve' is elevated for 2019. One way of reducing the risk (or at least err on the safe side) is to lower expectations as to what constitutes 'normal' rates in the form of the long run dot.
Qian Wang – Senior Economist
23 February 2018
www.vanguardinvestments.com.au
More Articles

SMSF assets reach record levels amid share market rally
How SMSF trustees are investing their retirement savings. . Over 1.1 million Australians are now...

Income-free areas set to increase from 1 July
People nearing retirement often want to know how much they can earn before it affects their pension, and now...

Many Australians have a fear of running out
Longevity risk is a growing concern for many working Australians as well as retirees. . The fear of...

LRBA interest rates increase for 2025
The safe harbour interest rate for related party limited recourse borrowing has changed for...

How to get into the retirement comfort zone
A third of Australians retire without a plan. Here's why you should have one. . Working and generating a...

Compliance focus impacts wind-ups
The ATO’s strategic increased focus on compliance is having a noticeable effect on the sector and is now the...

NALE bill passed by parliament
The bill that will introduce changes to the non-arm’s-length expenditure (NALE) provisions has passed...
Sofie Korac is an Authorised Representative (No. 400164) of Prudentia Financial Planning Pty Ltd, AFSL 544118 and a member of the Association of Financial Advisers.
Financial Advice Sydney and the North Shore Office based in Gordon NSW